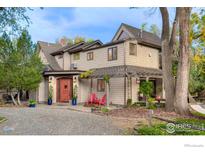
Below you can view all the homes for sale in the Linden subdivision located in Boulder Colorado. Listings in Linden are updated daily from data we receive from the Denver multiple listing service.
To learn more about any of these homes or to receive custom notifications when a new property is listed for sale in Linden, give us a call at 303-921-4595.
2 Results
Linden Boulder Colorado Homes For Sale
Similar Properties For Sale
2750 7Th St


$3,075,000
MLS# IR1035520,
Coldwell Banker Realty-boulder
2925 4Th St


$2,950,000
MLS# IR1026727,
Liv Sotheby's Intl Realty
Nearby Properties For Sale
90 Hawk Ln


$3,400,000
MLS# IR1037322,
Coldwell Banker Realty-boulder
864 Iris Ave


$3,500,000
MLS# IR1026464,
Re/Max Of Boulder, Inc
3737 26Th St


$3,500,000
MLS# IR1021528,
Re/Max Of Boulder, Inc
2935 19Th St


$2,595,000
MLS# IR1032297,
Milehimodern - Boulder
2941 21St St


$3,650,000
MLS# IR1033332,
Liv Sotheby's Intl Realty
Area Stats
These statistics are updated daily from the RE colorado. For further analysis or
to obtain statistics not shown below please call Highgarden Real Estate at
303-921-4595 and speak with one of our real estate consultants.
Popular Homes
$667,797
$499,950
127
1.6%
67.7%
87
$1,091,133
$725,000
243
0.4%
47.3%
83
$2,250,000
$2,250,000
2
0.0%
50.0%
26
$3,671,718
$2,400,000
95
0.0%
36.8%
110
$650,189
$549,990
424
1.9%
51.9%
61
$724,582
$665,000
21
4.8%
57.1%
101
$1,049,513
$799,000
731
0.0%
56.4%
69
$1,107,692
$907,500
128
0.8%
44.5%
62
$848,965
$690,000
227
0.4%
53.3%
82
$877,320
$807,065
329
0.0%
46.2%
77
$1,674,679
$1,177,500
252
0.0%
48.8%
66
$666,688
$617,000
93
1.1%
51.6%
49
$552,969
$499,950
114
0.9%
48.2%
100
$1,724,436
$1,724,950
60
0.0%
40.0%
66
$538,119
$535,000
122
2.5%
51.6%
73
$1,006,500
$894,000
8
0.0%
25.0%
52
$1,384,110
$1,200,000
267
0.4%
47.2%
62
$2,638,504
$2,000,000
71
0.0%
45.1%
48
$885,577
$875,000
26
0.0%
61.5%
85
$750,873
$696,500
52
0.0%
40.4%
64
$1,221,665
$799,950
20
0.0%
55.0%
87
$595,800
$525,000
5
0.0%
40.0%
58
$994,052
$850,000
139
0.0%
49.6%
63
$507,220
$509,900
35
0.0%
22.9%
49
$998,432
$674,000
461
0.0%
39.3%
61
$1,308,461
$1,275,000
121
0.0%
38.8%
61
$657,596
$574,995
80
0.0%
51.2%
74
$980,366
$875,000
143
0.0%
47.6%
58
$1,207,063
$971,500
123
0.0%
52.8%
71
$2,827,950
$2,495,000
40
0.0%
20.0%
60
$772,527
$692,500
26
0.0%
50.0%
60
$986,034
$749,950
25
0.0%
52.0%
95
$1,752,349
$1,195,000
37
0.0%
37.8%
77
$499,500
$499,500
2
0.0%
50.0%
83
$631,690
$499,000
53
1.9%
49.1%
128
$1,079,374
$1,059,500
66
0.0%
50.0%
75
$607,796
$519,900
39
2.6%
64.1%
60